2025-05-25
A small task I often face in R is looking up values in one set of data to add to another data frame. For example, I have a set of results from analyses in a data frame, but the full labels I want to use in tables and figures separately:
results <- data.frame(
  disease = c("all_cause_mortality",
              "ihd",
              "is",
              "ich",
              "mve"),
  result = rbinom(5, 100, 0.2)
)
results
## disease result
## 1 all_cause_mortality 23
## 2 ihd 21
## 3 is 24
## 4 ich 17
## 5 mve 20labels <- data.frame(
disease = c("all_cause_mortality",
"ihd",
"is",
"ich",
"mve"),
label = c("All-cause mortality",
"Ischaemic heart disease",
"Ischaemic stroke",
"Intracerebral haemorrhage",
"Major vascular event")
)
labels## disease label
## 1 all_cause_mortality All-cause mortality
## 2 ihd Ischaemic heart disease
## 3 is Ischaemic stroke
## 4 ich Intracerebral haemorrhage
## 5 mve Major vascular eventHere are a few ways to add the labels to the results…
merge() or dplyr::left_join() can be used
to merge the two data frames:
merge(results, labels, by = "disease", sort = FALSE)## disease result label
## 1 all_cause_mortality 23 All-cause mortality
## 2 ihd 21 Ischaemic heart disease
## 3 is 24 Ischaemic stroke
## 4 ich 17 Intracerebral haemorrhage
## 5 mve 20 Major vascular eventdplyr::left_join(results, labels, by = "disease")## disease result label
## 1 all_cause_mortality 23 All-cause mortality
## 2 ihd 21 Ischaemic heart disease
## 3 is 24 Ischaemic stroke
## 4 ich 17 Intracerebral haemorrhage
## 5 mve 20 Major vascular eventThe data frames can be merged the other way around to use the labels data to subset or choose the order:
labels2 <- data.frame(
  disease = c("mve",
              "is",
              "ich"),
  label = c("Major vascular event",
            "Ischaemic stroke",
            "Intracerebral haemorrhage")
)

merge(labels2, results, by = "disease", sort = FALSE)
## disease label result
## 1 mve Major vascular event 20
## 2 is Ischaemic stroke 24
## 3 ich Intracerebral haemorrhage 17dplyr::left_join(labels2, results, by = "disease")## disease label result
## 1 mve Major vascular event 20
## 2 is Ischaemic stroke 24
## 3 ich Intracerebral haemorrhage 17This approach is also particularly useful when multiple columns are needed to join the data frames.
match() can be used to identify the first appearance of
disease and extract the correct label:
table <- results
table$disease <- labels$label[match(table$disease, labels$disease)]
table
## disease result
## 1 All-cause mortality 23
## 2 Ischaemic heart disease 21
## 3 Ischaemic stroke 24
## 4 Intracerebral haemorrhage 17
## 5 Major vascular event 20Putting the labels in a named vector and subsetting using
[] is a concise approach:
labels <- c(
  all_cause_mortality = "All-cause mortality",
  ihd= "Ischaemic heart disease",
  is = "Ischaemic stroke",
  ich = "Intracerebral haemorrhage",
  mve = "Major vascular event"
)

table <- results
table$disease <- labels[table$disease]
table
## disease result
## 1 All-cause mortality 23
## 2 Ischaemic heart disease 21
## 3 Ischaemic stroke 24
## 4 Intracerebral haemorrhage 17
## 5 Major vascular event 20Use match() to also subset and order:
labels2 <- c(
  mve = "Major vascular event",
  is = "Ischaemic stroke",
  ich = "Intracerebral haemorrhage"
)

table <- results
table$disease <- labels2[table$disease]
table[match(labels2, table$disease),]
## disease result
## 5 Major vascular event 20
## 3 Ischaemic stroke 24
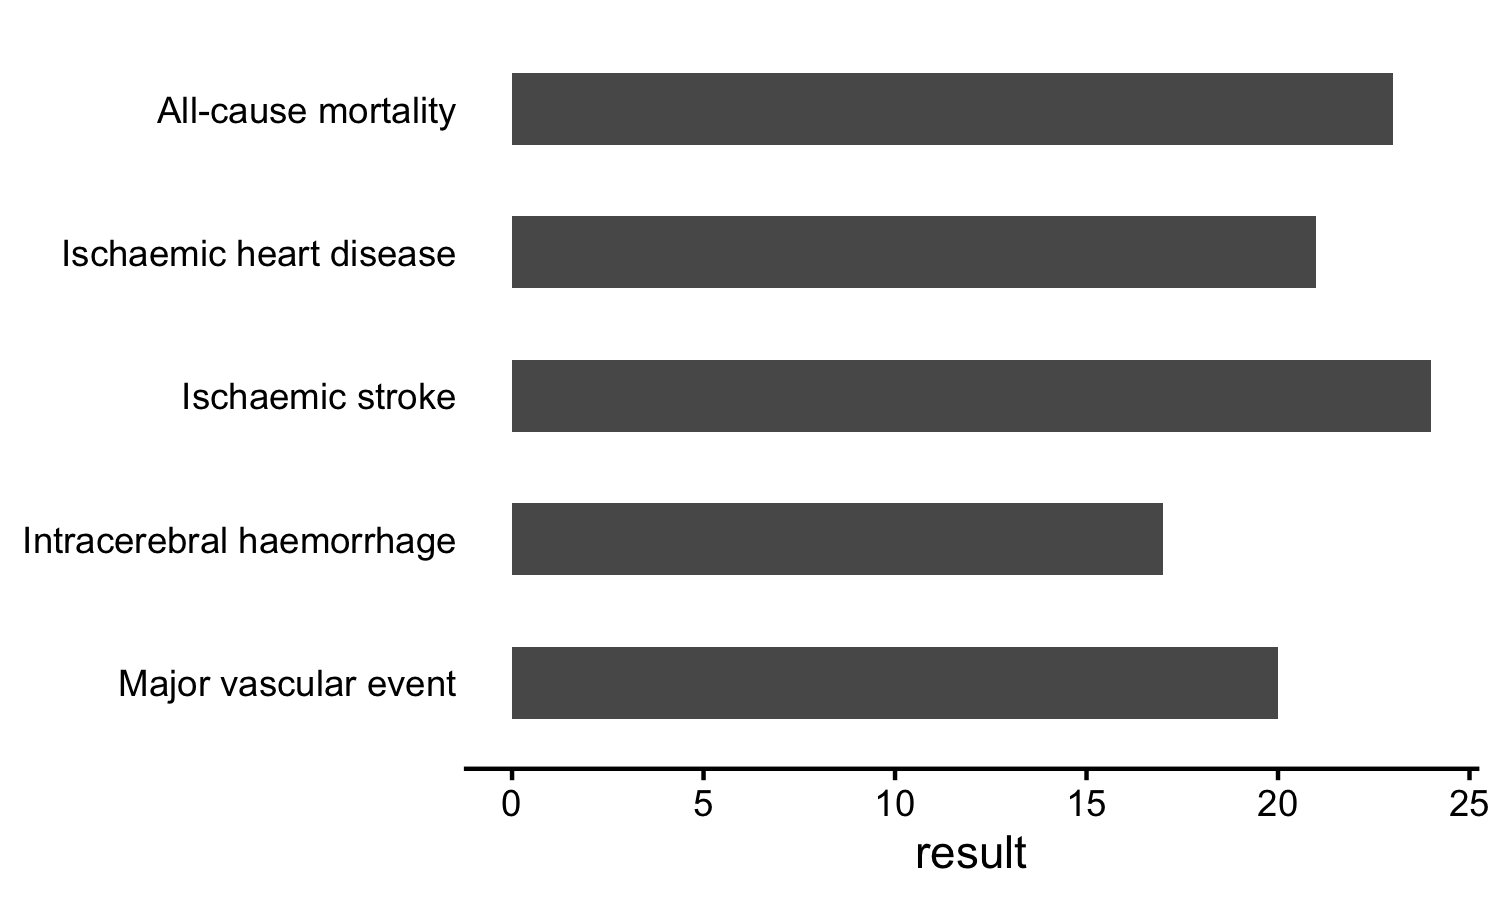
## 4 Intracerebral haemorrhage 17The named vector can also be useful in the labels
argument of a discrete scale in a ggplot:
library(ggplot2)

ggplot(results) +
  geom_col(aes(result, disease),
           width = 0.5) +
  scale_y_discrete(limits = rev(names(labels)),
                   labels = labels) +
  theme_classic() +
  theme(axis.ticks.y = element_blank(),
        axis.line.y = element_blank(),
        axis.title.y = element_blank())